3D Volumetric Results
Generating & Interpreting Volumetric Data
Exploring Chemistry includes many examples of visualizing Gaussian results as three-dimensional surfaces, including simple surfaces such as the electron density, lobed surfaces such as molecular orbitals, and mapped surfaces in which a second property is used to color an isosurface.
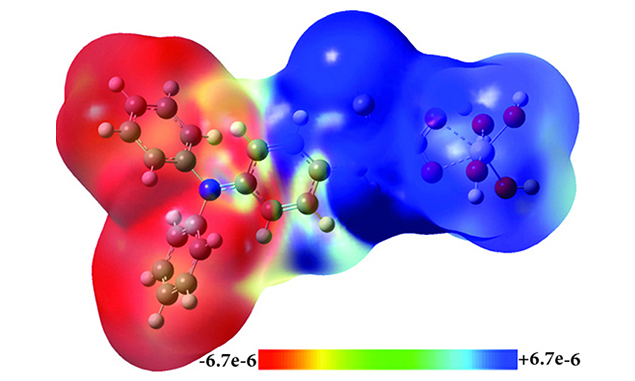
The illustration above is an example of this third type. It shows a difference density, which plots the difference between two electron density distributions as a surface with positive and negative lobes. Difference densities enable you to visualize the shift in electron density between two compounds or two environments.
This specific illustration plots the difference between the ground state and the excited state, mapping these values on the ground state density isosurface. The end values are selected to produce the maximum contrast. An isosurface of 0.0001 was used for this surface. The blue region indicates where the difference density is positive, meaning that the electron density in the excited state is larger than it is in the ground state while the red region indicates the opposite.
Related Posts
Tags
Share This